GIS guides and analysis
Written for the people who commission GIS work: 911 and public-safety teams, retail and franchise real estate, and agronomy. Each guide answers one question properly, with the methods, data sources and numbers behind it.
Blog
Practical guides and spatial analyses: NG911 data, site selection, coverage modelling and crop monitoring.
 2026-11-04
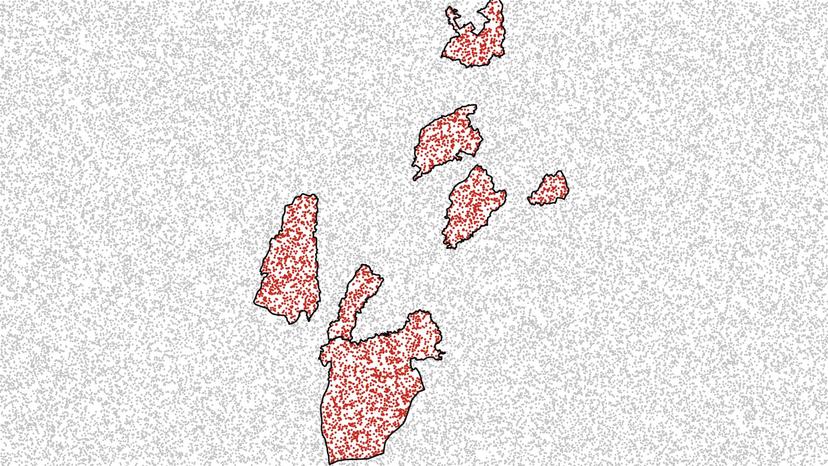
The Fastest Point-in-Polygon Join in Python: GeoPandas sjoin vs STRtree vs Prepared Geometries vs H3, Benchmarked to 10 Million Points
Point-in-polygon in Python, benchmarked on 10 million points: from 3.6 seconds to 2 minutes on the same Punjab districts, depending on which side you index.
 2026-10-25
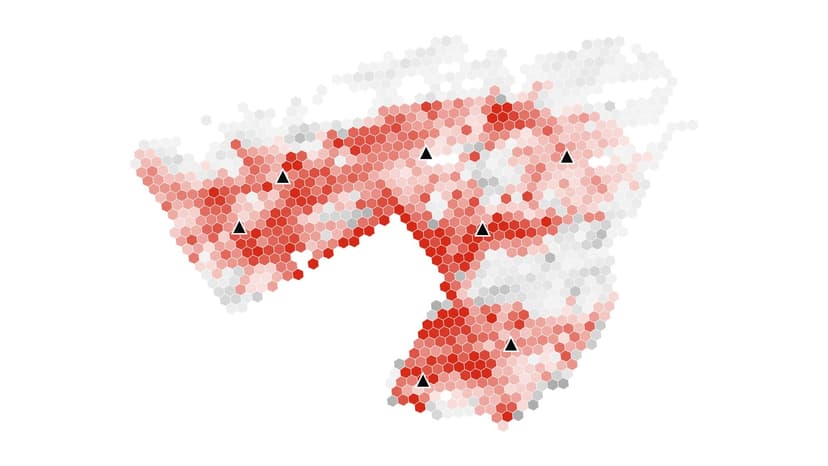
How Many Stations Is Enough? Reading the Coverage Curve Before You Build
Station coverage has steep diminishing returns. In Calgary 6 stations reach 96% of residents in 12 minutes, but covering everyone takes 39. How to read the curve.
 2026-10-18
Retail and Franchise Site Selection with GIS: A Method That Survives the Real Estate Committee
Retail site selection with GIS in 7 steps, from trade area and demand to cannibalization and validation, with a Huff gravity model worked by hand.
 2026-10-18
Fire Station Location Analysis: How Coverage Models Decide Where Stations Go
Fire station location analysis places stations with drive-time models: set covering, maximal covering and p-median. NFPA 1710 and a worked Calgary example.
 2026-10-13
Why Your Web Map Gets Distance and Area Wrong: Web Mercator Errors and Which CRS to Use
Web Mercator (EPSG:3857) inflates distance by 1/cos(latitude). In Calgary a 3-mile buffer drawn in it covers 40% of the intended area. Which CRS to use instead.
 2026-10-07
Drive-Time vs Radius Trade Areas: Why Your 3-Mile Ring Misleads You
Drive time vs radius trade area: across 169 Calgary sites, a 3-mile ring missed a 10-minute drive's population by over 25% at 42% of them.
 2026-10-01
Weighted Overlay and AHP for Site Suitability: How to Set the Weights, Test Them, and Avoid the Clustering Trap
Weighted overlay with AHP weights, tested on 1,114 Calgary sites: moving a weight 10 points kept 8 of the top 10, but switching to equal weights kept only 3.
 2026-09-29
How Much Does a GIS Consultant Cost? Rates, Pricing Models and What Drives a Quote
GIS consultant cost runs from about $20/hr on marketplaces to $80-$136/hr on US federal contracts. Sample project hours and pricing models compared.
 2026-09-22
Can LLMs Do GIS? What ChatGPT-Style Models Get Right, Where They Fail, and the Pattern That Works
Can ChatGPT do GIS? LLMs parse requests and write code well, but a common lat/lon distance shortcut is 59% off east-west in Calgary. The pattern that works.
 2026-09-17
How to Hire a GIS Contractor: Scoping Checklist, SOW Template and Red Flags
To hire a GIS contractor, scope deliverables first, then write a SOW fixing CRS, formats, metadata and ownership. Template and vendor questions inside.
 2026-09-08
Equal Interval vs Quantile vs Natural Breaks: How Classification Changes What Your Map Says
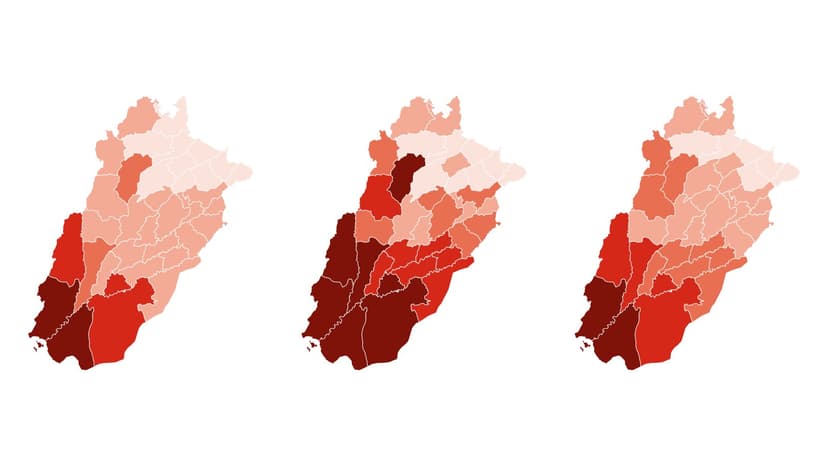
Choropleth classification decides your map's story. Mapping Punjab's out-of-school rate three ways put 2, 7, then 2 districts in the darkest class. How to choose.
 2026-09-03
The Modifiable Areal Unit Problem (MAUP): How Boundaries Change Your Results, With Two Real Examples
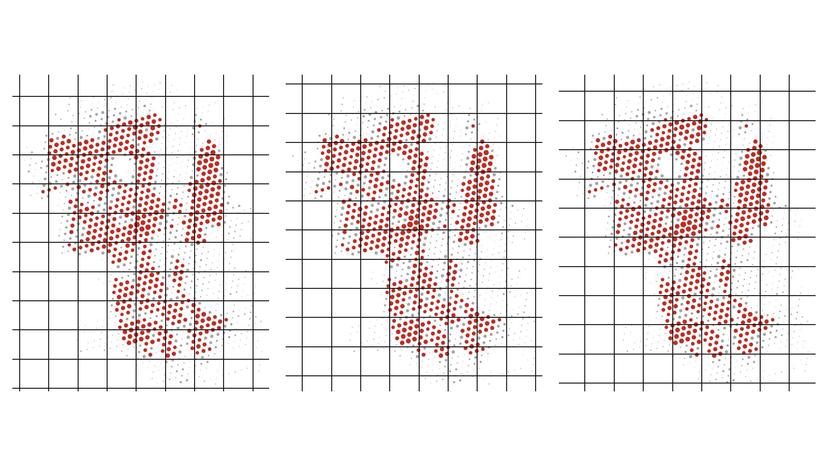
The modifiable areal unit problem in practice: one Punjab correlation rose from 0.38 to 0.80 when districts became divisions. How to spot the MAUP and test for it.
 2026-08-31
12 Automated QA Checks for Road Centerlines and Address Points Before NG911 Submission
NG911 GIS data validation in PostGIS: 12 automated QA checks for address ranges, parity, dangles, duplicate address points and boundary gaps, with SQL.
 2026-08-25
WorldPop vs LandScan vs GHSL vs Kontur vs Meta HRSL: Which Gridded Population Dataset to Use, and How to Check It
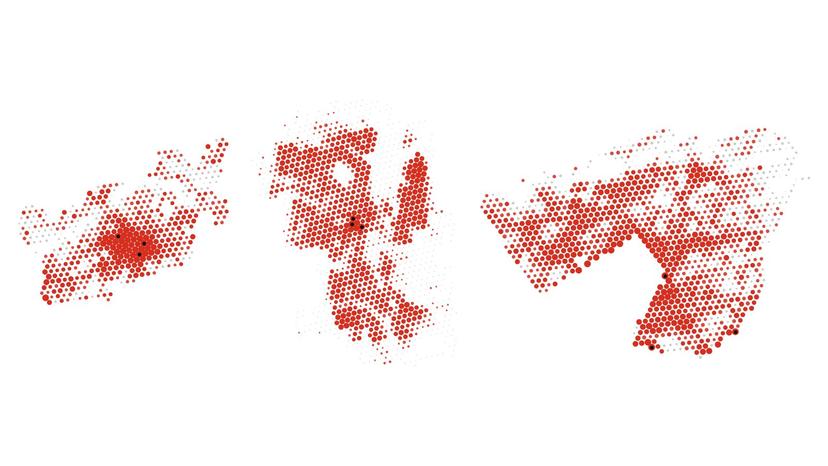
WorldPop vs LandScan vs GHSL, Kontur, Meta and GPW compared. Kontur's grid read 9.6% above Islamabad's 2023 census, or 3.1% below, by boundary rule.
 2026-08-19
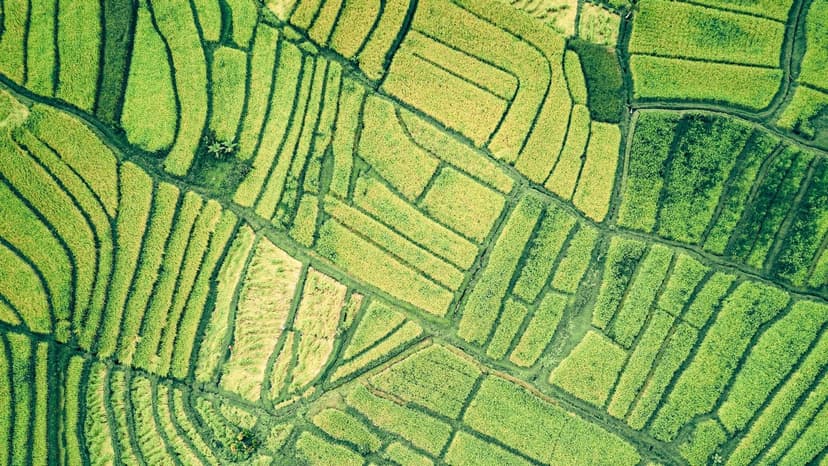
Sentinel-2 vs Landsat vs Planet for Crop Monitoring: Resolution, Revisit and Cost
Satellite imagery for agriculture: free 10 m Sentinel-2 covers most fields, Landsat adds history, PlanetScope adds 3 m daily images at about $1.80/ha/year.
 2026-08-11
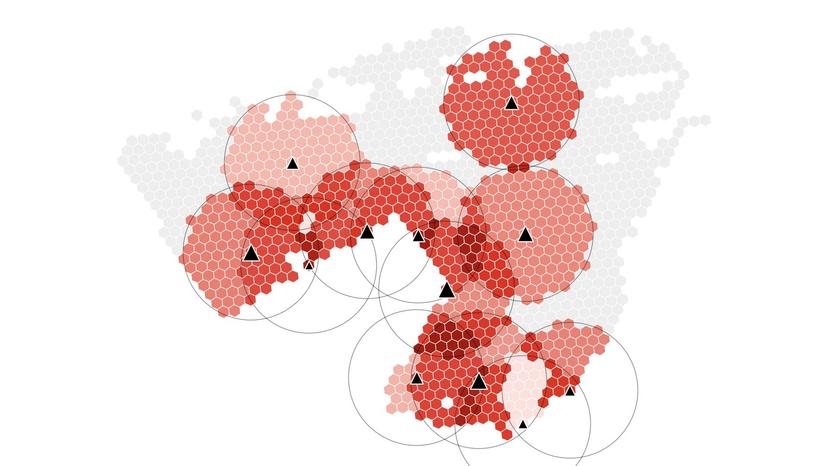
Two-Step Floating Catchment Area (2SFCA): How to Measure Spatial Access to Healthcare in GIS
Two-step floating catchment area (2SFCA) scores access as supply per resident. In an Islamabad test, 42% of people within 2 km of a clinic scored below median.
 2026-08-04
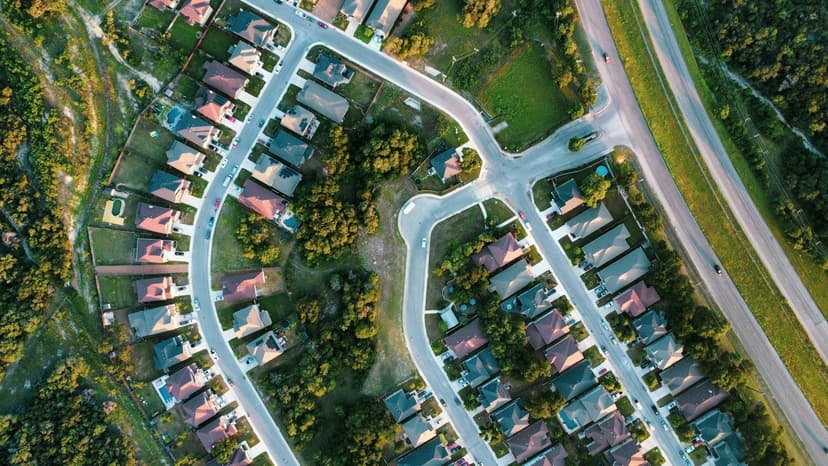
Franchise Territory Mapping: How to Draw Protected Territories That Hold Up
Franchise territory mapping done right: balance territories by households or target customers, not area, use stable boundaries, and match FDD Item 12.
 2026-07-29
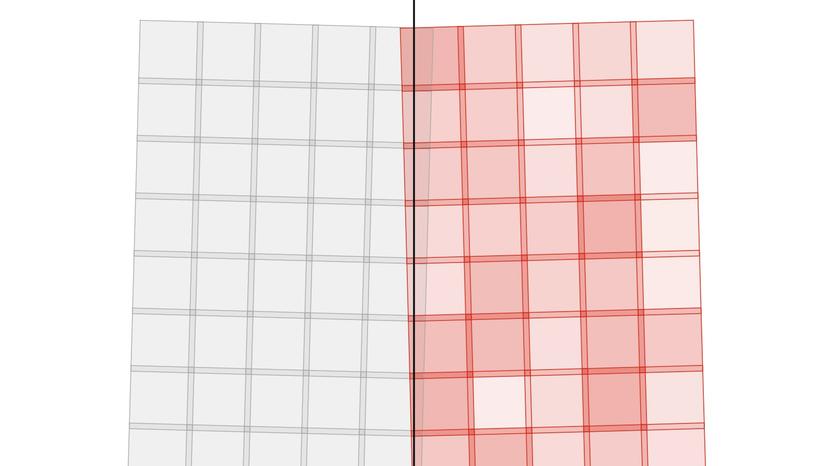
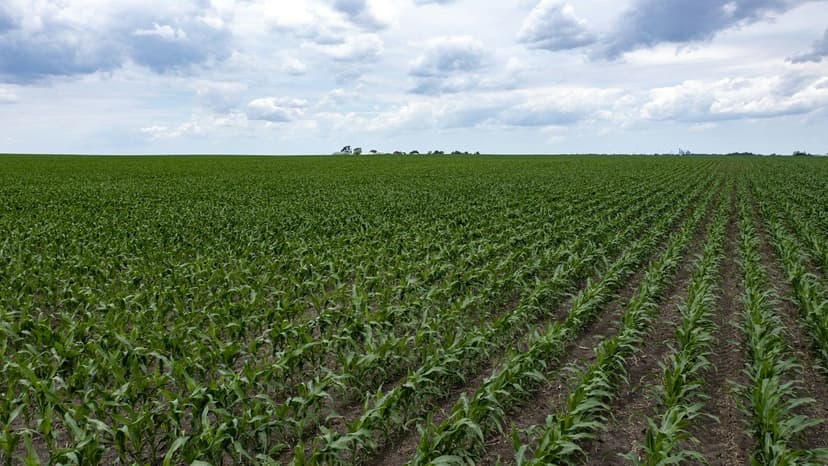
Sentinel-2 Tiles Explained: The MGRS Grid, UTM Zones and How to Mosaic Across Them
Sentinel-2 tiles are 109.8 km MGRS squares, each in its own UTM zone. Punjab needs 39 tiles across two zones. How to reproject, composite and level them.
 2026-07-21
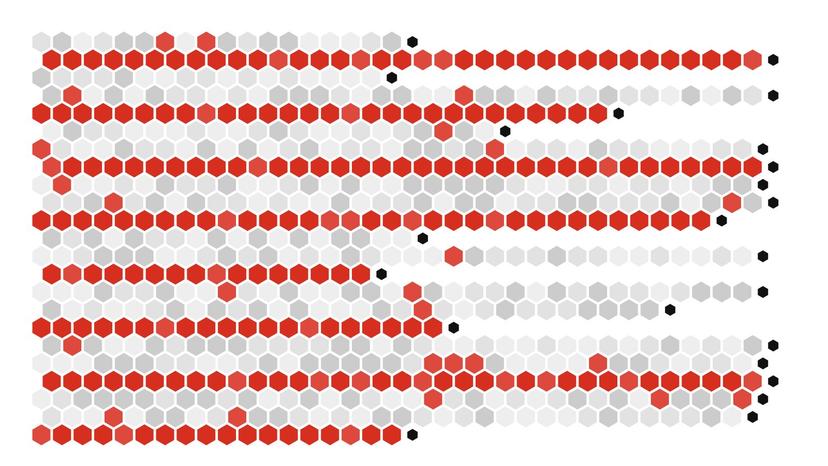
NDVI vs NDRE vs GNDVI: Which Vegetation Index Tells You What About Your Crop
NDVI vs NDRE: NDVI maps canopy cover early, NDRE tracks chlorophyll and nitrogen once the canopy closes, GNDVI sits between. Sentinel-2 band math and code.
 2026-07-14
Shapefile vs GeoPackage vs GeoParquet vs FlatGeobuf vs GeoJSON: Which Geospatial File Format to Use (Benchmarked)
Shapefile vs GeoPackage vs GeoParquet, benchmarked on 998,473 polygons: GeoParquet took 110 MB, the shapefile 494 MB. Which format to use for which job.
 2026-07-08
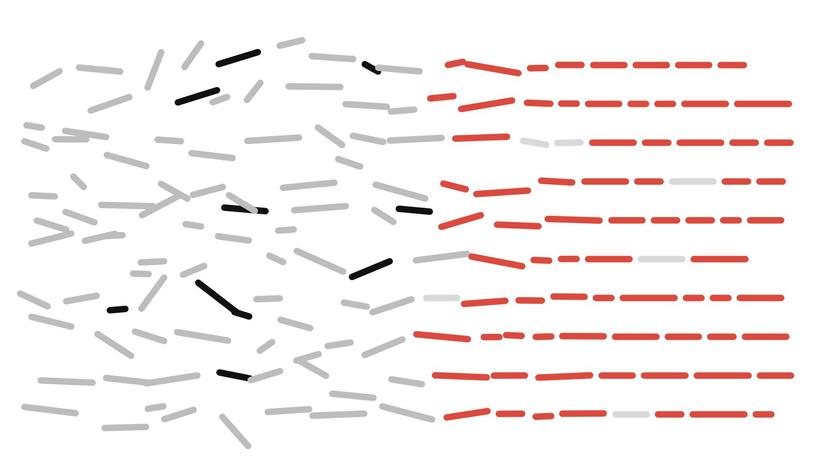
NG911 GIS Data Readiness: A Practical Checklist for Counties and Small Cities (NENA & CLDXF)
NG911 GIS data readiness means NENA-compliant centerlines, address points and boundaries that match legacy MSAG/ALI at 98%+. Checklist and self-score.
 2026-06-23
How to Clean Address Data Before Geocoding: Deterministic Rules First, an LLM Only for the Residue
Clean address data before geocoding with rules first: in my 30-address test, normalisation and lookup rules matched 23. Send only the residue to an LLM.
 2026-06-16
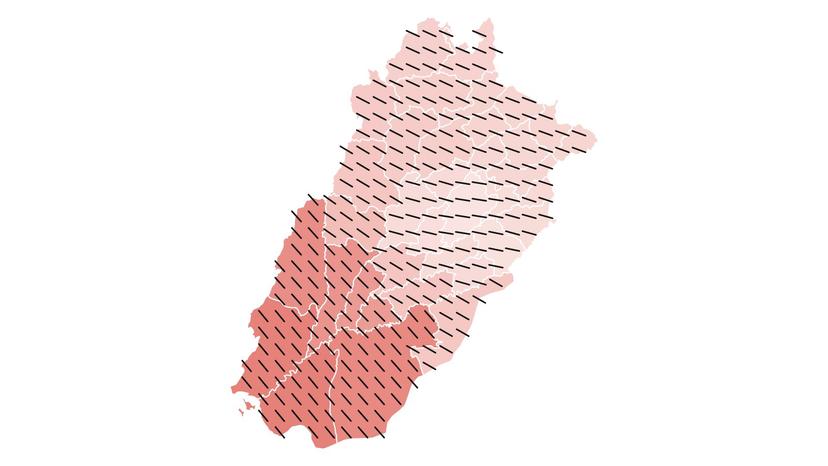
Geographically Weighted Regression (GWR) Explained: When One Coefficient Is Not Enough, Tested on Punjab's 36 Districts
GWR vs OLS on Punjab's 36 districts: OLS left residual Moran's I at 0.36. GWR raised R² from 0.56 to 0.84 and found a slope three times steeper in the south.
 2026-06-09
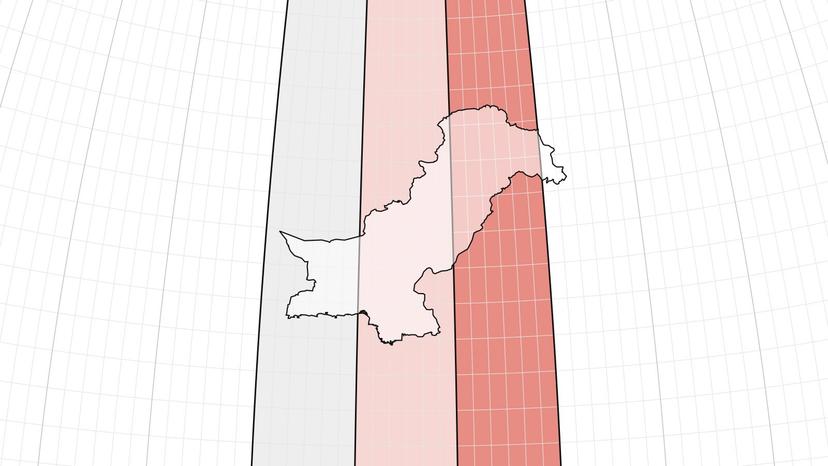
How Far Is the Nearest School or College in Islamabad?
A walking-distance access analysis of 2.5 million residents and 1,131 schools & colleges across the Islamabad Capital Territory.
 2026-05-26
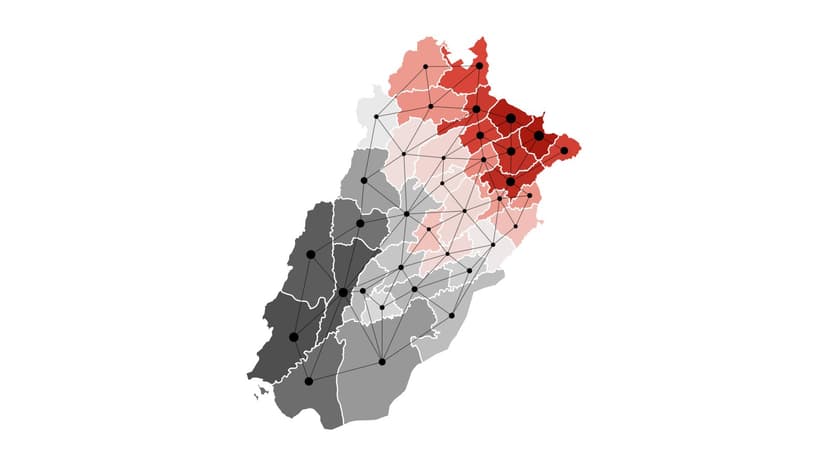
Which UTM Zone Is Pakistan In? Coordinate Systems, EPSG Codes and Kalianpur Datums for Pakistan
Pakistan spans UTM zones 41N, 42N and 43N (EPSG:32641 to 32643). Karachi is in 42N, Lahore and Islamabad in 43N. Which CRS to use and how to convert Kalianpur.
 2026-05-12
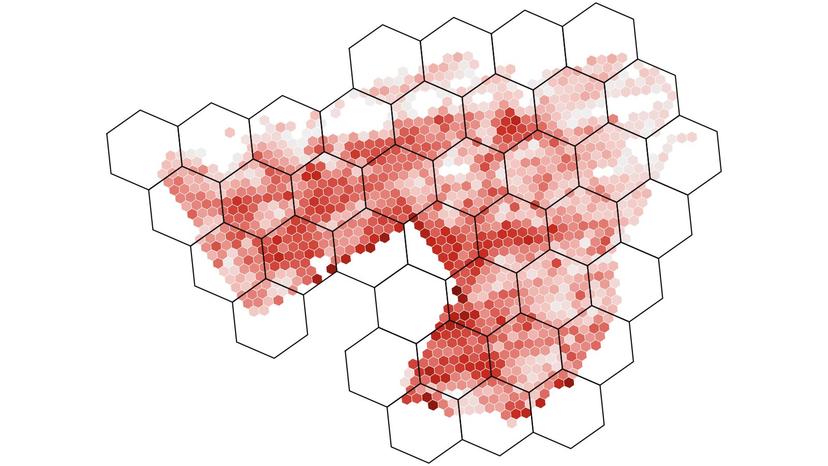
Hot Spot Analysis in GIS: Moran's I, Local Moran's I and Getis-Ord Gi* Explained on Punjab's 36 Districts
Hot spot analysis in GIS, explained on real data. Punjab's female literacy gave a Moran's I of 0.58, 8 Gi* hot spots and 7 cold spots. Python code included.
 2026-05-05
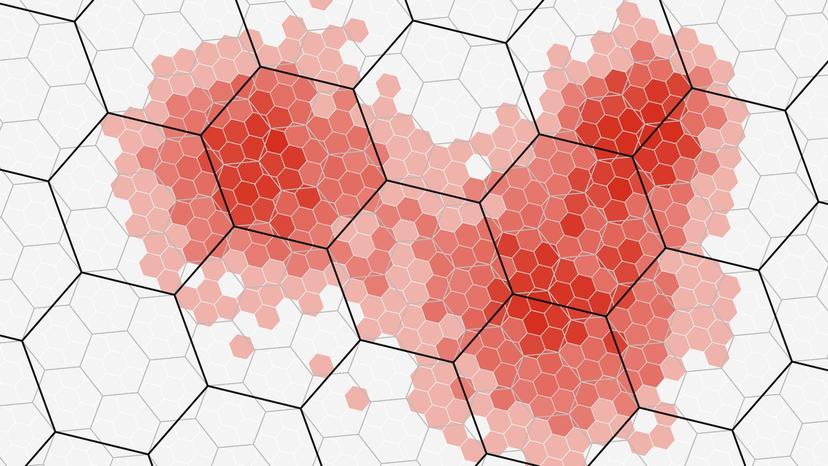
How to Estimate Population for Any Custom Area: Areal Weighting vs Dasymetric Mapping, Tested
Areal interpolation tested on 2,400 circles in Calgary and Islamabad: from 36 km² zones, area weighting missed a 2 km circle's population by a median 22%.
 2026-04-28
Which H3 Resolution Should You Use? A Practical Guide With a Size Table and a Calgary Test
Which H3 resolution to use: res 8 cells average 0.74 km², res 9 0.11 km². Rolling Calgary up from res 8 to 6 cut its peak density from 14,769 to 3,709 per km².
 2026-04-14
What Is Location Intelligence? How It Differs From GIS, With Real Examples
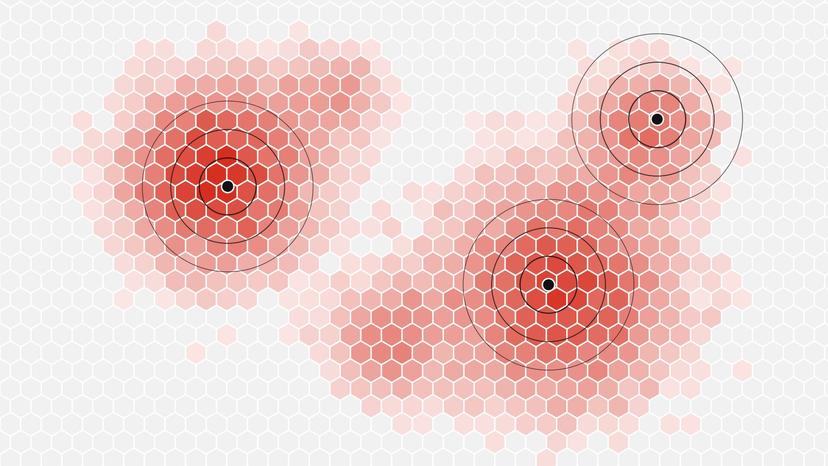
What is location intelligence? Using where people and places are to make business decisions. In Calgary, half of all residents live on 16% of the city's land.