
Retail site selection with GIS means estimating, for each candidate location, who can reach it, how much they spend, how much of that spending competitors and your own stores will take, and then checking the model against your existing stores. A method survives the real estate committee when every number traces to data and the forecast error is stated.
This article sets out a seven-step method for retail and franchise site selection, a Huff gravity model worked by hand, how to measure cannibalization, the US and Canadian data sources to use, and when this approach is the wrong one.
What does a real estate committee need from a site selection study?
A real estate committee is deciding whether to sign a lease or approve a franchisee's location. It does not need a beautiful heat map. It needs answers to five questions:
- How much will this store sell? As a range, not a point.
- Where will those sales come from? New customers, competitors, or our own stores.
- What could make it wrong? Access, visibility, a competitor opening, a co-tenant closing.
- How does it compare with the alternatives? Other sites in the same market, ranked on the same basis.
- How much do we trust the model? How it performed on stores we already have.
Most GIS site selection work answers the first and fourth questions with a score and skips the second, third and fifth. That is where studies die in committee. The method below is built around all five.
What data do you need for retail site selection in the US and Canada?
| Need | United States | Canada |
|---|---|---|
| Population, households, income, age | American Community Survey 5-year estimates at block group level (about 600 to 3,000 people each) | 2021 Census Profile by dissemination area (average 400 to 700 people) |
| Small-area boundaries | Census TIGER/Line block groups | Dissemination Area Boundary Files |
| Road network and drive times | OpenStreetMap with OSRM or Valhalla, or a commercial engine such as Esri or HERE | Same |
| Competitors and co-tenants | Your own competitor list, Overture Maps places, OpenStreetMap | Same |
| Visits and foot traffic | Mobility data vendors such as Advan (which bought SafeGraph's Patterns business in 2022) and Placer.ai | Check each vendor's Canadian coverage before buying |
| Your own performance | Store sales, square footage, opening dates, loyalty or delivery addresses | Same |
The last row is the most valuable and the most often ignored. Customer addresses from a loyalty program or delivery orders tell you the real shape of each store's trade area. No purchased dataset is a substitute for that.
Two practical differences between the countries. US reports usually describe distances in miles and Canadian reports in kilometres, so state the unit in every table. And ACS figures are survey estimates with published margins of error, while Canadian DA profiles come from the census of a single reference year, so in fast-growing suburbs both can be stale in different ways.
How do you do retail site selection with GIS, step by step?
Step 1: Define the trade area by drive time, not radius
Draw each candidate's trade area as a drive-time catchment at the hour your customers travel. Use your existing stores' customer data to choose the time: if 70% of a typical store's customers live within 12 minutes, use 12 minutes.
Rings are tempting because they are simple, but in a test of 169 Calgary sites, a 3-mile ring and a 10-minute drive differed in population by more than 25% at 42% of sites, and only 4 of the top 10 sites were the same under both methods. The full comparison is in drive-time vs radius trade areas.
Step 2: Measure demand
Demand is not population. It is the number of the right households multiplied by what they spend in your category. For each small area (block group or DA) inside the trade area, estimate:
- Households, not just people, because most retail spending is a household decision.
- The target segment, for example households with children under 10 for a tutoring franchise, or households above an income threshold for a premium grocer.
- Category spending per household, from a commercial consumer spending dataset or, better, from your own sales per household in mature trade areas.
Step 3: Map competition
List every competitor a customer would consider a substitute, with an attractiveness measure for each: floor area, number of service bays, seats, or a brand weight. This becomes the competitive set in the Huff model below. Missing one large competitor will inflate every forecast nearby, so ask local operators to check the list.
Step 4: Score accessibility and visibility
Drive time captures how far a site is. It does not capture whether a driver can get in. Check, on site or with street-level imagery:
- Which direction of traffic can turn in, and whether there is a median.
- Signalised access, and whether the site is on the going-home side of the road for evening trade.
- Visibility from the main road and signage rules.
- Parking and, for urban sites, transit and walking access.
These are usually scored as adjustments, not modelled. Record them explicitly so the committee sees them.
Step 5: Account for co-tenancy
Neighbouring tenants change traffic. A grocery anchor, a big-box store or a busy coffee shop can bring trips your site would not generate alone. Treat strong anchors as a bonus to attractiveness, and record which lease clauses depend on them. If the anchor leaves, the forecast should be rerun.
Step 6: Estimate sales and cannibalization with a gravity model
Combine demand, competition and travel time in a Huff model, worked in full in the next section. Run it twice, with and without the new site, to see how much of the new store's sales come from your own stores.
Step 7: Score, then validate against existing stores
Turn the outputs into a score or a sales forecast, then test the method on the stores you already have before using it on new sites. Details are in the validation section below.
How does the Huff model estimate a new store's sales?
The Huff model comes from David Huff's 1964 paper Defining and Estimating a Trading Area in the Journal of Marketing. It treats store choice as a probability. The probability that a shopper in zone i chooses store j is:
P(i, j) = (S_j^α ÷ T_ij^λ) ÷ Σ_k (S_k^α ÷ T_ik^λ)
where:
- S_j is store j's attractiveness, here its floor area.
- T_ij is the travel time from zone i to store j.
- α (alpha) controls how much size matters. Here α = 1.
- λ (lambda) is the distance-decay exponent: how quickly a store's pull fades with time. Here λ = 2.
- The sum in the denominator runs over every store the shopper could use.
Each store's estimated sales are the sum, over all zones, of P(i, j) multiplied by zone i's spending in the category.
The worked example
Three stores, four demand zones. Stores A and C belong to your brand. B is a competitor. C is the site under review.
| Store | Owner | Floor area (thousand sq ft) |
|---|---|---|
| A | You, existing | 20 |
| B | Competitor | 40 |
| C | You, proposed | 25 |
| Zone | Annual category spending | Drive time to A | to B | to C |
|---|---|---|---|---|
| Z1 | $12.0M | 5 min | 10 min | 8 min |
| Z2 | $8.0M | 12 min | 6 min | 9 min |
| Z3 | $15.0M | 9 min | 15 min | 4 min |
| Z4 | $5.0M | 14 min | 8 min | 12 min |
| Total | $40.0M |
Step 1: Compute each store's pull from each zone
Pull = floor area ÷ (drive time)². For Z1 and store A: 20 ÷ 5² = 20 ÷ 25 = 0.800.
| Zone | Pull of A | Pull of B | Pull of C | Total pull |
|---|---|---|---|---|
| Z1 | 20/25 = 0.8000 | 40/100 = 0.4000 | 25/64 = 0.3906 | 1.5906 |
| Z2 | 20/144 = 0.1389 | 40/36 = 1.1111 | 25/81 = 0.3086 | 1.5586 |
| Z3 | 20/81 = 0.2469 | 40/225 = 0.1778 | 25/16 = 1.5625 | 1.9872 |
| Z4 | 20/196 = 0.1020 | 40/64 = 0.6250 | 25/144 = 0.1736 | 0.9007 |
Step 2: Convert pull to probabilities
Divide each pull by the zone's total. Each row adds to 1, allowing for rounding.
| Zone | P(A) | P(B) | P(C) |
|---|---|---|---|
| Z1 | 0.503 | 0.251 | 0.246 |
| Z2 | 0.089 | 0.713 | 0.198 |
| Z3 | 0.124 | 0.089 | 0.786 |
| Z4 | 0.113 | 0.694 | 0.193 |
Step 3: Multiply by spending to get captured sales
Figures are in millions of dollars, to three decimals so the rows and columns add up.
| Zone | Spending | A captures | B captures | C captures |
|---|---|---|---|---|
| Z1 | 12.000 | 6.035 | 3.018 | 2.947 |
| Z2 | 8.000 | 0.713 | 5.703 | 1.584 |
| Z3 | 15.000 | 1.864 | 1.342 | 11.794 |
| Z4 | 5.000 | 0.566 | 3.470 | 0.964 |
| Total | 40.000 | 9.178 | 13.533 | 17.289 |
The three stores' sales add to $40.0M, the full market, as the model requires. Rounded: A $9.18M, B $13.53M, C $17.29M.
Step 4: Rerun without the new store to measure cannibalization
With only A and B in the market, the same calculation gives A $18.31M and B $21.69M.
| Without C | With C | Change | |
|---|---|---|---|
| Store A (yours) | $18.31M | $9.18M | −$9.13M |
| Store B (competitor) | $21.69M | $13.53M | −$8.16M |
| Store C (yours, new) | n/a | $17.29M | +$17.29M |
| Your brand total | $18.31M | $26.47M | +$8.16M |
Store C's forecast of $17.29M looks excellent on its own. But $9.13M of it, 53%, comes out of your own store A. The net gain to the brand is $8.16M, which is exactly what C takes from the competitor. That is the number the committee should see first, and in a franchise system it is also the number the franchisee who owns store A will ask about.
Step 5: Check how sensitive the answer is to the decay exponent
The exponent λ = 2 above was chosen for illustration. It should be calibrated, and the answer moves when it changes:
| λ | C's forecast | A's loss to C | Net new to the brand | Share of C's sales cannibalized |
|---|---|---|---|---|
| 1 | $15.01M | $6.18M | $8.83M | 41% |
| 2 | $17.29M | $9.13M | $8.16M | 53% |
| 3 | $17.90M | $11.53M | $6.36M | 64% |
A steeper decay makes the new store look stronger on its own, because shoppers in Z3 stick to the nearest store, but it also makes it eat more of store A. The net new revenue falls from $8.83M to $6.36M. If you only report C's own forecast, you will be most optimistic exactly when cannibalization is worst.
Calibrate α and λ from your own stores' customer origins and sales. Esri's Business Analyst has a Huff model tool and a separate calibration tool for this, and the same fit can be done in Python or R.
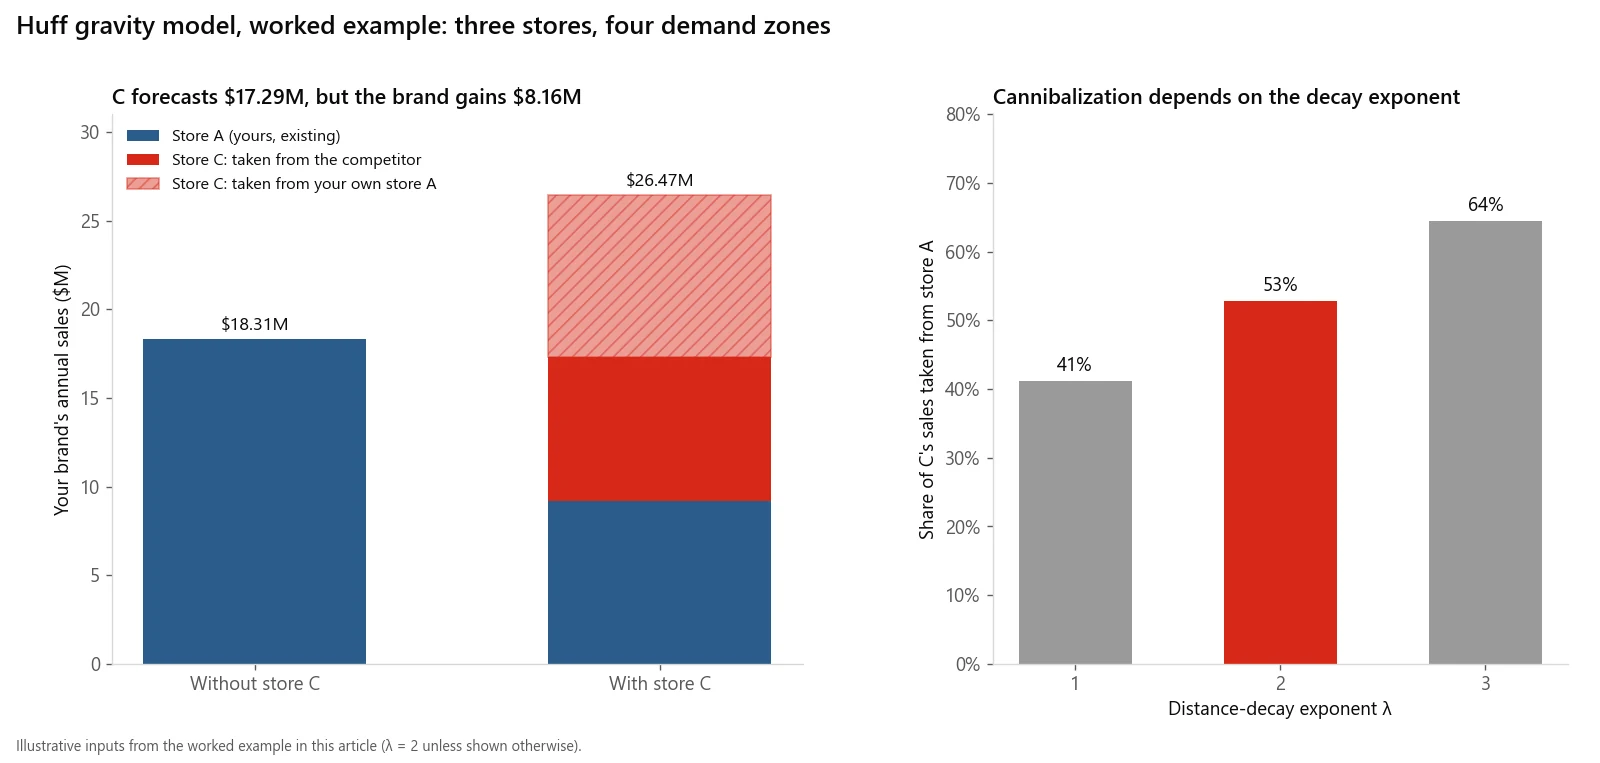
The worked example in one picture: store C's headline forecast versus what the brand actually gains, and how the answer moves with the decay exponent.
How do you score and validate candidate sites?
A Huff forecast covers demand, competition and travel time. Access, visibility and co-tenancy usually enter as a scored adjustment. A simple structure:
| Component | Measure | Weight |
|---|---|---|
| Net new sales | Huff forecast minus cannibalization | Largest single weight |
| Access and visibility | Site visit scorecard | Set from experience |
| Co-tenancy | Anchor strength and lease dependency | Set from experience |
| Risk | Pipeline competitors, road works, anchor lease expiry | Penalty |
Weights are a judgement. The validation is what makes them defensible:
- Score every existing store with the same model and the data that existed when it opened, where you have it.
- Compare scores or forecasts with actual sales, after the store has matured.
- Check the ranking. If the model's top quarter of existing stores are not mostly your actual top performers, change the model, not the committee's minds.
- Hold out stores. Calibrate on most stores and test on the rest, so you are not grading the model on its own homework.
- Report the error. If the model's forecasts on existing stores were typically off by 20%, the new site's forecast is a range of plus or minus 20%, and the committee should see that range.
A system with only a handful of stores cannot calibrate much. In that case say so, use analogues from similar markets, and lean more on the drive-time demand and competition maps than on a precise sales number.
How did this method work on a franchise rollout?
I built GIS-based location scoring for Taleemabad to guide a nationwide school franchise rollout, ranking catchments by population, competition and accessibility using QGIS, census data and OpenStreetMap. The structure was the one above, with schools in place of stores: population as the demand layer, existing schools as the competition layer, and the accessibility of each catchment as the third.
Two lessons from that kind of work carry over to retail franchising:
- Ranking catchments is more reliable than forecasting one. When a franchisor is choosing where to recruit franchisees, a consistent ranking of markets is often more useful than a precise sales number for each.
- Competition data is the weak link. Population comes from a census. Competitor lists have to be assembled and checked, and gaps in them distort every score nearby.
You can see the same kind of coverage analysis applied to fire stations in the Site Selection Showdown map game on this site.
What about protected territories in franchise systems?
A franchise site that scores well can still be off the table if it falls inside a territory already granted to another franchisee, or so close to one that it invites a dispute. Before scoring, overlay every candidate on the current territory map and screen out conflicts. If the territories were drawn as rings or ZIP code lists, that check can be messier than it sounds. Franchise territory mapping covers how to draw territories that hold up, and how they connect to the disclosure document.
When is GIS site selection the wrong approach?
- When there is no real choice of site. If only one lease is available in a market, the question is whether to enter, and a market-level demand estimate answers it faster.
- When you have too few stores to validate. A model calibrated on three stores is a guess with a formula. Use it to rank, not to forecast.
- When sales do not depend on location. Destination formats, heavy online sales and delivery-first concepts behave differently. A gravity model assumes shoppers travel to the store.
- When the closed-market assumption fails. The Huff model shares out a fixed pool of spending. It does not create new demand. If a new store would grow the category, for example the first of its kind in a market, the model will understate it.
- When the decision is really about rent. If two sites are close on sales and far apart on occupancy cost, the decision is financial and the GIS work is supporting evidence, not the answer.
How much does a site selection study cost?
It depends mainly on how many sites are reviewed, whether you have usable customer data for calibration, and whether mobility data has to be bought. A study of a few shortlisted sites using public census data and an existing competitor list is a much smaller job than a market-wide model calibrated on a store network. For rates and how quotes are put together, see GIS consultant cost.
If you need a site selection study or a franchise location model scoped or done, email me at mahad.imran29@gmail.com.