For most broadacre crop monitoring, free Sentinel-2 imagery is enough: 10 m pixels, a 5-day revisit and red-edge bands for nitrogen. Use Landsat or NASA's HLS product when you need history back before 2015 or more clear days at 30 m. Pay for PlanetScope (3 m, near-daily) when fields are small or decisions cannot wait.
This guide to satellite imagery for agriculture covers a side-by-side table checked against ESA, NASA, USGS and Planet, a field-size rule of thumb worked out pixel by pixel, published PlanetScope prices, cloud cover, and when satellites are the wrong tool.
Sentinel-2 vs Planet vs Landsat: how do they compare?
| Sentinel-2 | Landsat 8 and 9 | HLS v2.0 (NASA) | PlanetScope (SuperDove) | |
|---|---|---|---|---|
| Pixel size | 10 m (visible, NIR), 20 m (red edge, SWIR) | 30 m multispectral, 15 m panchromatic | 30 m, all bands | 3 m |
| Revisit | 5 days at the equator with two satellites | 8 days combined | Every 2 to 3 days | Near-daily |
| Red-edge bands | Yes, three (B5, B6, B7) | No | Yes in the Sentinel-2 part (HLSS30), at 30 m | Yes, one (705 nm) |
| Archive starts | June 2015 | 1972 (Landsat 1) | April 2013 (L30), late 2015 (S30) | July 2014; 8-band SuperDove from March 2020 |
| Licence | Free, full and open, with attribution | Free, no cost to users | Free | Commercial subscription |
| Cost | $0 | $0 | $0 | From $1.80/ha/year (US and Canada) |
Sources: ESA SentiWiki and ESA facts and figures for Sentinel-2; NASA and USGS for Landsat; NASA Earthdata and the Earth Engine HLSS30 catalog for HLS; Planet's PlanetScope documentation and Planet Agriculture pricing for PlanetScope.
Sentinel-2 status in 2026
Sentinel-2C launched on 5 September 2024 and now flies with Sentinel-2B as the nominal pair, giving the 5-day equatorial revisit. Sentinel-2A was not retired. It has been imaging under an extended campaign since March 2025, and in October 2026 Copernicus extended that campaign to 31 December 2027. For now that means three Sentinel-2 satellites are collecting, which helps most in cloudy seasons.
The red-edge bands are why Sentinel-2 is the default for nitrogen work, and why the B5 band sits at 20 m rather than 10 m matters. The band math is covered in NDVI vs NDRE vs GNDVI.
Landsat 8 and 9
Landsat 9 launched on 27 September 2021. With Landsat 8 it observes the same location every 8 days at 30 m. Landsat has no red-edge band, so it is limited to NDVI-type indices for vegetation. Its strength is history: the program began with Landsat 1 on 23 July 1972, which makes it the only free source for multi-decade baselines, such as which parts of a field have been consistently weak over many seasons.
Harmonized Landsat Sentinel-2 (HLS)
HLS is NASA's answer to "why not use both?" It resamples Sentinel-2 to 30 m, adjusts both sensors to behave alike, and publishes them on a common grid as HLSL30 (Landsat) and HLSS30 (Sentinel-2). The combined record gives global land observations every 2 to 3 days at 30 m. HLSS30 keeps the three red-edge bands, resampled to 30 m.
Since February 2025, LP DAAC also publishes HLS-VI, a ready-made vegetation index product with nine indices including NDVI, EVI, SAVI and NDMI. Neither NDRE nor GNDVI is among them, so red-edge work still means computing your own from HLSS30 or native Sentinel-2.
PlanetScope
PlanetScope is a large fleet of small satellites that images nearly all land every day at 3 m. The current SuperDove sensor has eight bands, including a red edge at 705 nm that Planet describes as interoperable with Sentinel-2 B5. It has no shortwave-infrared band, so moisture indices such as NDMI are out. Each scene is roughly 630 km², and data are available as visual, top-of-atmosphere and surface reflectance products. For index work, use surface reflectance.
How big does a field need to be for 3 m, 10 m or 30 m imagery?
A field-level number is only as good as the pixels inside the field. Pixels on the boundary mix crop with headland, road, ditch or the neighbour's crop, and geolocation error shifts the boundary by a fraction of a pixel from date to date. The standard fix is to drop a one-pixel buffer around the edge and only use "pure" interior pixels.
For a square field of side L and a pixel size p, with the pixel grid landing at a random offset (it never lines up with your fence), the expected number of pure interior pixels after a one-pixel buffer is:
pure pixels ≈ (L/p − 3)²
The 3 comes from 2 pixels lost to the buffer (one each side) plus, on average, 1 pixel lost to grid misalignment along each axis. I checked the formula against a simulation of 4,000 random grid offsets per case, and it matches the simulated averages to within one pixel.
Worked example: a 40-acre field
A 40-acre field is 16.19 ha, or 161,874 m². As a square, that is 402.3 m on a side, which is also the size of a quarter-quarter section, the classic "forty" of the US Public Land Survey System.
At 10 m: 402.3 / 10 = 40.2, minus 3 is 37.2, squared is about 1,390 pure pixels, 86% of the 1,619 pixels the area nominally holds.
At 30 m: 402.3 / 30 = 13.4, minus 3 is 10.4, squared is about 108 pure pixels, only 60% of nominal.
Pure interior pixels by field size
| Field | Area | Side (square) | 3 m | 10 m | 20 m | 30 m |
|---|---|---|---|---|---|---|
| Small field or plot | 5 ac / 2.0 ha | 142 m | ~1,970 (88%) | ~126 (62%) | ~17 (34%) | ~3 (14%) |
| Quarter-quarter ("forty") | 40 ac / 16.2 ha | 402 m | ~17,190 (96%) | ~1,390 (86%) | ~293 (72%) | ~108 (60%) |
| Quarter section (US PLSS and Canadian DLS) | 160 ac / 64.7 ha | 805 m | ~70,350 (98%) | ~6,000 (93%) | ~1,390 (86%) | ~567 (79%) |
Percentages are the share of the field's nominal pixel count that survives as pure interior pixels.
Three things stand out. A 5-acre field at 30 m keeps about 3 pure pixels, which is not a field average but an anecdote. A 40-acre field at 20 m (Sentinel-2's red-edge resolution) still has about 300 pure pixels, which is plenty for a field mean and a coarse zone map. And on a Prairie quarter section, even 30 m Landsat keeps nearly 80% of its pixels.
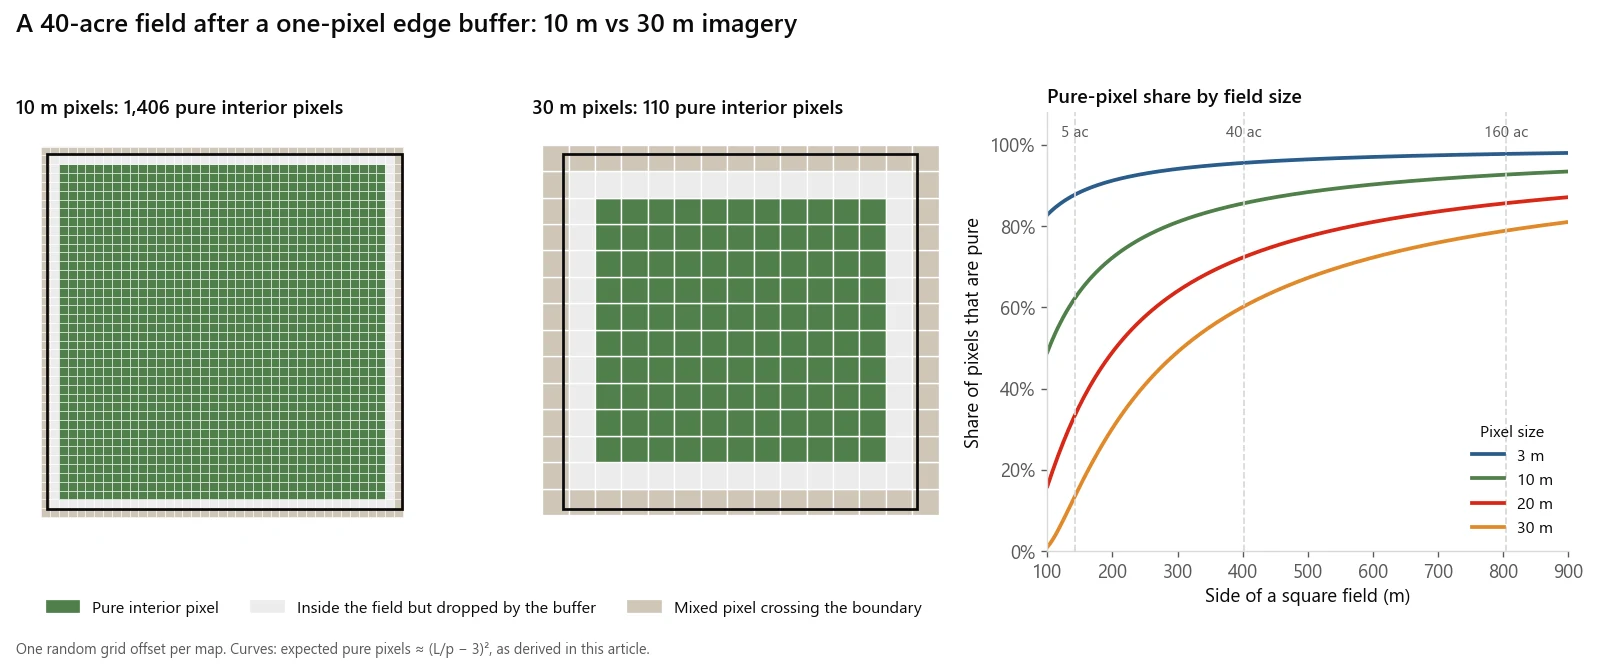
The same 40-acre field at 10 m and 30 m after a one-pixel edge buffer, and how the pure-pixel share grows with field size.
The rule of thumb
Aim for at least 10 pure pixels across the field's narrowest dimension, which means the field should be at least 13 pixels wide:
| Pixel size | Minimum width | Minimum square field |
|---|---|---|
| 3 m (PlanetScope) | 39 m | 0.15 ha / 0.4 ac |
| 10 m (Sentinel-2 visible and NIR) | 130 m | 1.7 ha / 4.2 ac |
| 20 m (Sentinel-2 red edge) | 260 m | 6.8 ha / 16.7 ac |
| 30 m (Landsat, HLS) | 390 m | 15.2 ha / 37.6 ac |
Width matters more than area. A long, narrow 40-acre field 100 m wide keeps only about 7 pure pixels across at 10 m and almost none at 30 m. For irregular fields, buffer the boundary inward by one pixel in GIS and count the pixels whose footprint falls fully inside.
Is free Sentinel-2 data enough for crop monitoring?
For most North American row crops and small grains, yes. Free data covers you when:
- Fields clear the size rule above. Fields laid out on forties and quarter sections, the survey grid behind much of the US Midwest and the Canadian Prairies, clear the 10 m threshold many times over.
- The question is weekly, not daily. Crop progress, in-season zone maps, end-of-season reviews and nitrogen checks against a reference strip all work at a 5-day revisit with some cloud loss.
- You need red-edge at field scale. Sentinel-2's 20 m red-edge bands are adequate for field-level NDRE on fields above about 7 ha.
- You need history. Landsat reaches back to 1972, and HLS gives a consistent 30 m record from 2013. PlanetScope's archive starts in 2014 and its current sensor in 2020.
The free products also come with free crop masks. The USDA Cropland Data Layer moved to 10 m resolution with the 2024 edition, built from harmonized Sentinel-2 and Landsat 8 and 9 data. In Canada, the AAFC Annual Crop Inventory maps crops nationally at 30 m. Use them to stratify by crop before comparing index values.
With free imagery the whole cost is processing and analysis. A regional mosaic that crosses tile and UTM zone boundaries takes real engineering, which is why I built sen2auto, a pipeline that mosaics Sentinel-2 L2A scenes across zones with cloud-aware compositing. For what that kind of work typically costs to commission, see how much a GIS consultant costs.
When is paying for PlanetScope worth it?
Planet publishes its prices. As of October 2026, the Planet Agriculture plan puts the US and Canada in its highest-priced tier at $1.80 per hectare per year (about $0.73 per acre). That includes next-day imagery, areas of interest as small as 1 ha, and a two-year archive. Planet's own calculator estimates $900 a year for 500 ha and $18,900 for 10,500 ha, so the per-hectare rate on that page does not fall with area; volume pricing goes through sales.
There is also a general-purpose Insights Flex plan from $1,100 a year, enough to order about 100 km² of PlanetScope data a month. But its self-service tiers only include imagery 30 days old and older, which rules it out for in-season decisions. For crop monitoring, the Agriculture plan is the relevant one.
PlanetScope earns its cost when:
- Fields or plots are small. Below about 2 ha, Sentinel-2 cannot give a reliable field number and PlanetScope can. Specialty crops, seed production plots, research trials and fields broken up by shelterbelts or sloughs fall here.
- Timing is the product. Hail, flooding, frost and emergence problems are judged in days. A daily acquisition attempt turns a 5-day wait into a next-day look.
- Cloud keeps beating the revisit. More attempts mean more chances at a clear image (see the next section).
- You need within-field detail at red-edge wavelengths. Sentinel-2's red edge is 20 m. PlanetScope's is 3 m.
It is usually not worth it for large, uniform broadacre fields where the decision is weekly. On a 1,000 ha operation, $1,800 a year buys imagery whose extra resolution mostly shows the same zones Sentinel-2 already shows. And because PlanetScope is a fleet of many small satellites rather than one carefully calibrated instrument, check index consistency between scenes before treating small date-to-date changes as real.
How much does cloud cover limit crop monitoring?
Cloud is the biggest practical limit on optical imagery, and it is worst when it matters most. A global analysis of 10 to 13 years of twice-daily MODIS cloud flags over cropland found that the early and mid growing season, the periods that matter most for crop identification and yield forecasting, have both frequent and extensive cloud cover (Whitcraft et al., 2015, Remote Sensing of Environment). I have not found a published, Sentinel-2-specific clear-sky statistic for the Prairies or Midwest that I would quote, so here is how to reason about it instead.
If each acquisition over a field has a probability c of being clear, the chance of at least one clear image in a window with n acquisitions is:
P(at least one clear) = 1 − (1 − c)^n
Take an illustrative c of 0.4 and a two-week window:
| Source | Acquisitions in 14 days | P(at least one clear) |
|---|---|---|
| Landsat 8 + 9 (8-day) | 1 to 2 | 40 to 64% |
| Sentinel-2, two satellites (5-day) | about 3 | 78% |
| HLS (every 2 to 3 days) | about 5 to 7 | 92 to 97% |
| PlanetScope (daily attempt) | about 14 | over 99% |
Real cloud is correlated from day to day, since a stalled weather system covers many consecutive passes, so actual gains from daily imagery are smaller than this independent-trials model suggests. The ranking holds, though, and it is the strongest argument for combining Sentinel-2 with Landsat through HLS before paying for anything.
Where do I download Sentinel-2, Landsat and HLS imagery?
- Sentinel-2: the Copernicus Data Space Ecosystem, free with registration. Use Level-2A (surface reflectance) and the SCL band for cloud masking.
- Landsat 8 and 9: USGS EarthExplorer. Use Collection 2 Level-2 surface reflectance.
- HLS and HLS-VI: NASA Earthdata Search, or Google Earth Engine.
- PlanetScope: through a Planet subscription or a reseller.
When are satellites the wrong approach?
- Plant-level questions. Stand counts, row gaps and weed patches need centimetre pixels. Even 3 m PlanetScope pixels span several corn rows. Use a drone.
- Same-pass nitrogen application. Applicator-mounted canopy sensors measure and apply in one pass, regardless of cloud. Satellite maps are better for planning zones and checking results than for real-time rate control.
- Persistent cloud during a fixed decision window. If the window is a week and the forecast is overcast, no optical constellation will help. Radar sees through cloud; AAFC already uses RADARSAT Constellation Mission data alongside optical imagery in its crop inventory, but radar answers different questions and needs different expertise.
- Absolute comparisons across sensors. An NDVI of 0.8 from PlanetScope and 0.8 from Sentinel-2 are not the same measurement. Pick one source per time series, or calibrate between them.
- Fields below the size rule for your sensor. The table above is the check. If a field fails it, the number you report is mostly edge.
If you need imagery sources compared for a specific crop and region, or a monitoring pipeline set up, email me at mahad.imran29@gmail.com.