Location intelligence is the practice of using data about where people, places and risks are to make a business decision about where to act. GIS supplies the tools and data, and location intelligence is the layer that turns them into an answer: which site to open, how many stations to build, how to split a sales region. It works because demand is concentrated. Half of Calgary's residents live on 16% of the city's land.
This article gives a working definition, explains how location intelligence differs from GIS, lists the questions it answers and the data and methods behind them, and walks through real examples from my own analyses of Calgary, Islamabad and Bahawalpur.
What is location intelligence?
Location intelligence (LI) is the process of turning spatial data into decisions about where. The question always has a geographic answer, and the answer always has a business consequence.
Three things make a piece of analysis location intelligence:
- It starts from a decision. "Where should store number 12 go?" or "Which neighbourhoods are outside our 8-minute response standard?"
- It models how people move or where demand sits. Straight-line distance is rarely enough. Travel time on the road network, population density and competition all change the answer.
- It ends in a ranked or quantified recommendation. A list of candidate sites scored by expected sales, a coverage percentage, or a territory map where every territory holds within 5% of the same number of households.
Industry analysts describe the field in similar terms. A Gartner benchmarking study for the European Commission frames it as the process of deriving meaningful insight from geospatial information, and IBM's overview of location intelligence describes it the same way: insight from location data, applied to a business decision.
What is the difference between location intelligence and GIS?
GIS is the toolset and the data. Location intelligence is the decision layer built on top of it.
A geographic information system stores, edits, analyses and maps spatial data. It is used by engineers maintaining a water network, by 911 authorities keeping road centrelines accurate, and by planners drawing zoning maps. Most GIS work keeps an organisation's spatial records correct. Location intelligence uses the same software and data to answer a commercial or service question, usually for someone outside the GIS team.
| GIS | Location intelligence | |
|---|---|---|
| Main purpose | Store, maintain, analyse and map spatial data | Decide where to act |
| Typical owner | GIS or IT team | Real estate, operations, marketing, emergency services leadership |
| Typical output | Layers, maps, geoprocessing results | Ranked sites, coverage curves, balanced territories, forecasts |
| Key question | "Is the data correct and well mapped?" | "Which option is best, and by how much?" |
| Typical tools | ArcGIS, QGIS, PostGIS | The same tools, plus routing engines, optimization solvers and statistical models |
| Success measure | Data quality and availability | A better decision: more sales, faster response, fairer territories |
In practice the two overlap. A good location intelligence study depends on clean GIS data, and a GIS team that answers decision questions is doing location intelligence whatever its job titles say.
What questions does location intelligence answer?
Location intelligence answers five recurring kinds of question. Most projects are one of these, or a combination.
| Question type | Example | Usual method |
|---|---|---|
| Where are my customers and potential customers? | Which neighbourhoods hold most of the target households? | Geocoding, density mapping, hot spot analysis |
| Where should I open, relocate or close? | Which of 12 candidate sites will sell most without cannibalising existing stores? | Trade areas, Huff gravity model, regression on existing store sales |
| How do I serve an area? | How many fire stations reach 90% of residents within 8 minutes? | Location-allocation: set covering, maximal covering, p-median |
| How do I split an area fairly? | Six franchise territories with similar household counts | Territory balancing, constrained clustering |
| Where is the risk? | Which insured properties sit in a flood zone or wildfire interface? | Hazard overlays, exposure aggregation |
The first question underpins the other four. Every site score, coverage figure and territory count depends on where demand actually sits.
Why does population concentration matter so much?
Demand is very unevenly spread, so analysis that treats an area as uniform gives wrong answers. I measured this on the three cities behind the Site Selection Showdown game, using Kontur Population (November 2023) on H3 hexagons of about 0.7 km² each. I sorted each city's hexagons from densest to least dense and recorded how much land it takes to hold a given share of residents.
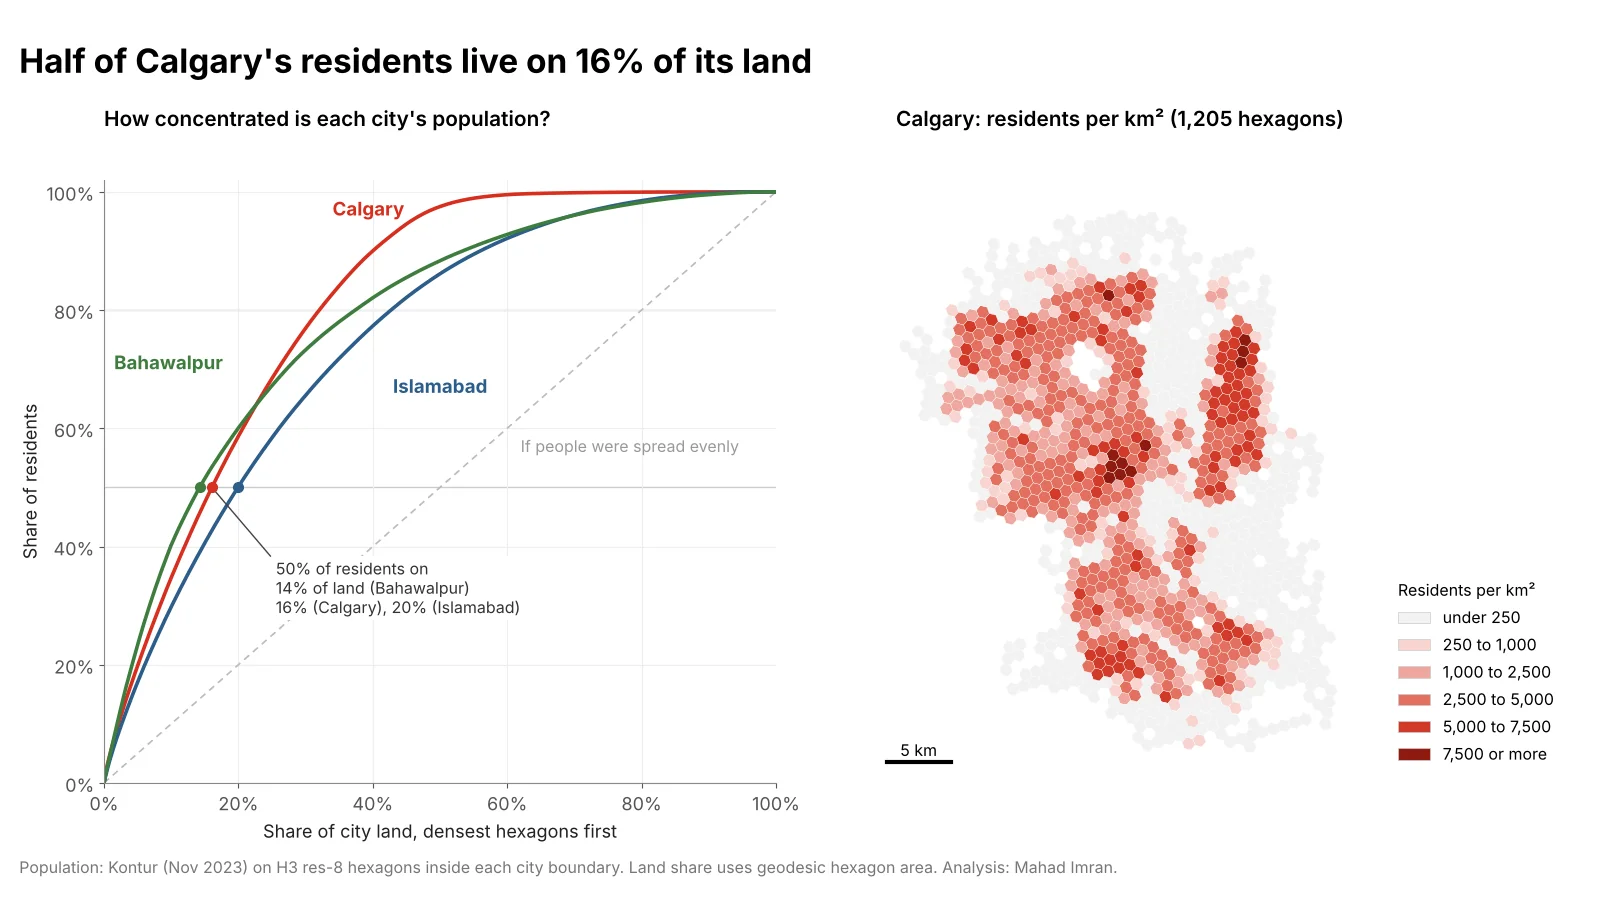
Each curve sorts a city's hexagons from densest to least dense. The further a curve bows above the dashed diagonal, the more concentrated the population.
| City | Residents | Land (hexagon area) | Land holding 50% of residents | Land holding 80% of residents | Land under 250 people/km² |
|---|---|---|---|---|---|
| Calgary | 1,463,328 | 847 km² | 16% | 32% | 44% of land, 0.9% of residents |
| Islamabad Capital Territory | 2,590,233 | 964 km² | 20% | 43% | 12% of land, 0.5% of residents |
| Bahawalpur | 673,192 | 424 km² | 14% | 37% | 18% of land, 1.4% of residents |
Land is the summed geodesic area of the hexagons, computed with the h3 Python library.
Three things follow for any location decision:
- Averages mislead. Calgary's average density over its hexagons is 1,727 residents per km², but the median hexagon holds 687 per km². A site in a typical hexagon sits in a much thinner market than the city average suggests.
- Two sites a few kilometres apart can face very different markets. In Calgary, 8.6% of the land is at 5,000 residents per km² or more and holds 30.6% of residents. Whether a trade area catches that land or the 44% of land that is nearly empty decides the forecast.
- Cities differ in shape. Islamabad spreads its population more evenly across planned sectors and housing schemes, so a site there competes for a wider, flatter market. Bahawalpur is compact at the core with a long, sparse fringe. A rule of thumb borrowed from one city will not transfer.
You can run the same check on your own market in a few lines of Python:
import json, h3, numpy as np

hexes = json.load(open("calgary.json"))["hexes"]          # H3 cells with a 'pop' field
pop  = np.array([h["pop"] for h in hexes], float)
area = np.array([h3.cell_area(h["id"], "km^2") for h in hexes])

order = np.argsort(-pop / area)                          # densest first
cum_pop  = np.cumsum(pop[order])  / pop.sum()
cum_land = np.cumsum(area[order]) / area.sum()

for share in (0.5, 0.8):
    print(f"{share:.0%} of residents live on {np.interp(share, cum_pop, cum_land):.1%} of the land")
What data does location intelligence use?
Location intelligence combines a demand layer with layers that describe access, competition and context. The common inputs:
- Population grids. Modelled population on a regular grid, such as Kontur, WorldPop or the Global Human Settlement Layer. They are consistent across countries and easy to aggregate into any trade area. My comparison of gridded population datasets covers how they differ.
- Census demographics. Counts of households, income, age and spending from national statistics agencies. More detailed than grids, but tied to census units that vary in size.
- Points of interest (POIs). Competitors, anchors such as grocery stores and schools, and complementary businesses, from OpenStreetMap, Overture Maps or commercial providers.
- Road networks. The basis for drive-time and walk-time catchments, usually OpenStreetMap routed with an engine such as OSRM or Valhalla, or a commercial routing API with historical traffic.
- Mobility data. Anonymised, aggregated device movements that show where visitors to a place come from. Valuable for retail, expensive, and subject to privacy rules.
- Your own records. Geocoded customers, sales by store, incident locations. These are usually the best data in the project, because they measure your actual demand.
A shared spatial index helps join these. Many teams aggregate everything to the same H3 hexagons so that population, POIs and sales line up cell by cell. The H3 resolution guide covers which cell size to choose.
Which methods does location intelligence rely on?
Four method families cover most projects.
Trade areas. A trade area is the zone a site draws customers from. A radius ring is the quickest version and a drive-time polygon (isochrone) is the more realistic one. In my test of drive-time versus radius trade areas across 169 Calgary sites, a 3-mile ring and a 10-minute drive enclosed similar land, but their population counts differed by more than 25% at 42% of sites.
Gravity models. The Huff model, published by David Huff in 1963, estimates the probability that a customer in each area shops at each store, from the store's attractiveness and the travel time to it, divided by the same for all competing stores. It produces market share and sales forecasts, and it measures cannibalisation when you add a store near your own. The retail site selection method works a Huff model through by hand.
Location-allocation. These optimization models choose the best set of sites from a list of candidates. Set covering finds the fewest sites that reach all demand within a standard, maximal covering (Church and ReVelle, 1974) reaches the most demand with a fixed number of sites, and p-median minimises average travel time. They are the standard tools for emergency services, depots and clinics.
Territory balancing. Partitioning a region into territories with similar demand, compact shapes and boundaries on recognisable features. It is used for franchise territories, sales regions and delivery zones.
What do location intelligence examples look like in practice?
Here are five real analyses, each built on the same Calgary, Islamabad and Bahawalpur population and road data.
- Retail site selection. A seven-step method from trade area to validation, with a Huff gravity model estimating a new store's sales and the share taken from an existing store nearby. See retail and franchise site selection with GIS.
- Trade area choice. A ring and a drive-time polygon around the same site can disagree on population by more than a quarter. That gap flows straight into any sales forecast. See drive-time vs radius trade areas.
- Franchise territories. Splitting Calgary into six territories of equal land area left the largest with 2.5 times the residents of the smallest. Balancing on population brought every territory to within 1.2% of an even split. See franchise territory mapping.
- Fire station placement. Coverage models placed against the NFPA 1710 four-minute travel standard, compared with naive placement. See fire station location analysis.
- How many stations. At a 12-minute drive, 6 well-placed stations reach 96% of Calgary's residents, but covering every reachable resident takes 39. See the coverage curve.
You can also try the decision yourself. The Site Selection Showdown asks you to place three stations in one of the three cities and scores you against the optimal solution.
What are common location intelligence use cases by industry?
| Industry | Typical use cases |
|---|---|
| Retail and restaurants | New store sites, closures, cannibalisation, trade area marketing |
| Franchising | Protected territories, development schedules, market potential per territory |
| Emergency services and public sector | Station location, response time standards, school and clinic access |
| Logistics and delivery | Depot location, delivery zones, last-mile catchments |
| Real estate | Site scoring, tenant mix, demand around a development |
| Insurance and banking | Exposure to flood, wildfire and other hazards, branch networks |
| Telecoms and utilities | Coverage gaps, network build priority by population served |
The methods repeat across industries. A clinic network and a coffee chain both need demand, travel time and a model for choosing among candidates.
When is location intelligence the wrong tool?
Location intelligence adds little when location is not the constraint. If a business sells mostly online, if the only available sites are in one shopping centre, or if a lease decision turns on rent and visibility of a single unit, a spatial model will not change the outcome much.
It is also weak without good demand data. Modelled population grids are a sound starting point, but a forecast for a specialist retailer needs evidence about its own customers. If you have years of geocoded sales, use them before buying any third-party layer.
What should you take from this?
Location intelligence is GIS put to work on a decision. Start with the question, model where the demand really is and how people reach it, and finish with a ranked or quantified answer that someone can act on. Because population is so concentrated (half of Calgary on 16% of its land, half of Bahawalpur on 14%), small differences in where a site or boundary falls make large differences in the result. That is the case for doing the analysis properly.
If you want a site selection, coverage or territory study built on your own data, email me at mahad.imran29@gmail.com.